
Squaring Time in a Prior Trend with the Price Range of the Current Trend
The application of this technique requires three pieces of information if you are working with daily data:
- the number of trading days (TD) or
- the number of calendar days (CD) in the prior trend or swing, and
- the price range of the current swing.
You can measure a price range from close-to-close, from high-to-low, or from close-to-high or low.
With the application of all the Square of Nine techniques, once you know how to convert price and time to degrees, the implementation of all the techniques is fairly simple. The devil is in the details of deciding how to establish a price or a price range and when to convert natural prices into three digits.
The period from July ’02 through January ’03 provides some easily distinguishable swings with sharp edges in many of the indexes so it’s a good time period in which to do backtesting and some practice in applying this technique. It’s also the very recent past, so we do not have any of the “things are different now” issues to deal with that often come up in market analysis discussions.
Chart 7 shows the daily SPX cash for that period. The price and time ranges are from high to low for each swing. The number of points of travel for each swing shows this as a period with tremendous opportunities for trading the major indexes.
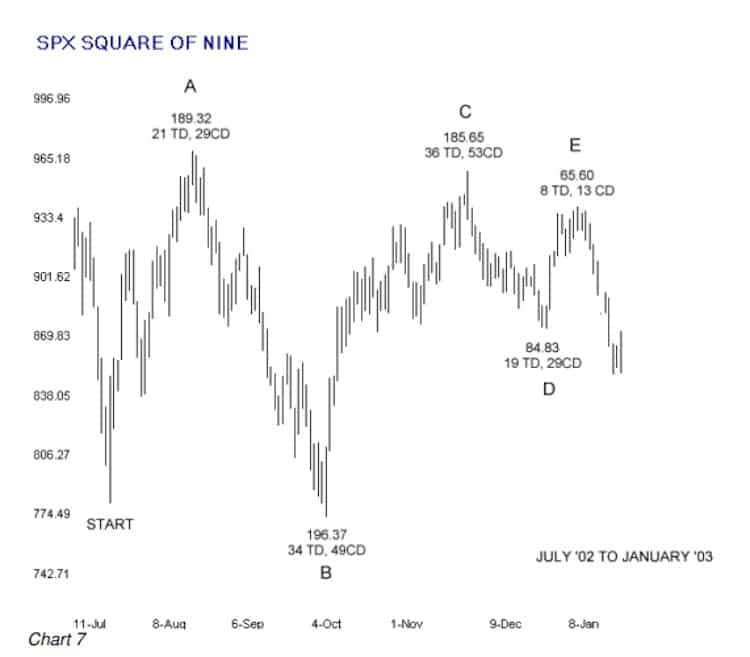
The next two charts show particular time periods of Chart 7 in more detail.

On a closing price basis, from START to A there was a swing of 22 TD. If you were doing your analysis at the close of trading at Point B, you would determine if the market squared price and time that day by measuring the close-to-close price range of the swing from A to B, converting that price range into degrees (185.94 = 70 degrees), converting the 22 TD into degrees (22 = 259 degrees) and seeing if you got a hit. 259 – 70 = 189. Nine degrees separation from a multiple of 90 degrees is too much separation to call it a squaring. Close-to-low numbers work out to a swing of 186.90 points = 76 degrees. 259 – 76 = 183 degrees, providing an acceptable 3 degrees separation.
Note that we’re using rounded numbers for most of these examples. You can quickly get the degrees for any number up to 225 from the Static Numbers to Degrees Table. The whole process takes only seconds once the raw data is gathered together.
At Point C, the price range of the swing on a closing basis is 162.11 points, which is a tad more than 266 degrees. The duration of the prior swing was 33 TDs, which converts to 89 degrees, putting the price range at Point C and the time units of the prior swing within a few degrees of square at an offset of 180 degrees. 266 – 89 = 177. If the multiple of 90 degrees happens to be 180 degrees, that’s even “better,” and if it’s 360 degrees, that is the “best.”

At Point D the prior swing was 35 CD on a closing basis and the price range on a closing basis was about 63 points. 35 = 120 degrees and 63 = 124 degrees squaring within about 4 degrees of unity or 360 degrees.
Point E is yet another squaring of price and time. 30 CD = 41 degrees and 56 points = 42 degrees, within about 1 degree of unity or 360 degrees.
If you’re like the rest of us you probably have an entire library of books on trading and technical analysis (thank you for adding this one). In most of those books, which may be valuable in their own right, if there was any reference to W.D. Gann and the concept of squaring price and time, it was probably something like this: “if price travels 90 points in 90 days…” How far we’ve come!
Use The Predictive Qualities of the Square of Nine
Because one side of the price-time comparison is fixed, the number of TDs and CDs of the prior swing, we can use this application to examine the predictive qualities of the Square of Nine. This is easier done if you have a copy of the Static Numbers to Degrees Table in front of you. In the last example, the swing from D – E on Chart 9, we were working with 30 TDs. Since we already know that 30 TDs is 41 degrees on the Square of Nine we need only look at the Table of Numbers and Degrees to see which price ranges will square with 41 degrees. Staring in the first column and working through the table we can pick out price ranges of about 12, 30, 56, 90, 182, and 240 points that we know will square with 30 TDs at 360 degrees on the Square of Nine.
And since we also already know the starting price of the current swing it’s simple enough to figure out a list of future prices that will complete one of the required price ranges that will square with 30 TDs. From then on, you need only check today’s bar to see if it contains a price that will complete the square.
Remember the “contained within” concept? The high, low, and close each occur at a precise moment in time during the life of the price bar under examination. The price that will complete a perfect squaring could occur anywhere between the high and low of that price bar. We cannot ignore that!
It gets a little more complicated but still manageable when you add the 90 degree offsets that will also square the current range with time. In addition to the above list, a complete list of price ranges would include numbers that fell on the 131, 221, 311 degree angles as well. A shorter but still very good list would include only the numbers that fell on the180 degree offset at 221 degrees. For the period from July ’02 through January ’03 that we covered in the examples, all the squaring occurred at either 360 or 180 degrees, although that will not be the case for every other incident.
| << Squaring Current Price With Time From A Prior Change In Trend |
Squaring The Price Range in the Prior Trend with Time in the Current Trend >> |


Pingback: Square Of Nine 7.2 Squaring Current Price With Time From A Prior Change In Trend
Pingback: SO9 7.4 Squaring The Price Range In The Prior Trend With Time In The Current Trend