
The Three Digit Controversy
There are a couple things that we did not cover in the last section on constructing a Square of Nine Roadmap Chart. One of them is what we call the three digit controversy.
When we constructed the SPX chart we calculated the spacing of the vertical time line by taking the square root of the starting pivot price. In that example, the starting pivot price was around 800 and the square root of 800 rounded out to a time dimension of 28 bars. The time dimension on the Square of Nine Roadmap Charts remains constant regardless of the actual duration of the price data.
For example, the SPX chart is daily data, and the time spacing is 28 trading days. The time spacing interval would remain 28 bars for Hourly or Weekly data that started from the pivot price level of 800 except, of course, the actual time elapsed would be 28 hours or 28 weeks.
But look again at the DJX Hourly in Chart 3. The square root of the base price of 84.26 is 9 rounded, and there’s no way the vertical time lines on that chart are separated by nine bars. Also, if you’ve done the math yourself for Chart 3 you found out that 85.72 is not on a 45 degree angle up from the DJX natural trading price 84.26. The first 45 degree angle up from the natural trading price of 84.26, if we do the math with a .25 factor, is 88.91, so what gives?
As a general rule, when calculating price angles (the horizontal lines) and time spacing for the Square of Nine Roadmap Charts we want to calculate with a number that has three significant digits, or in other words, three digits to the left of the decimal point.
Before doing the calculation for the 45 degree angles and for the time spacing on the DJX charts we converted the base price 84.26 to 842.6 before taking the square root. That provided us with a time spacing of 29 bars on the hourly Roadmap chart. The 45 degree angles we calculated for the horizontal price lines were based on a starting price of 842.6 (84.26 x 10) and then converted back to two digits for placement on the chart.
For example, price on the first 45-degree angle up computed out to 857.2 before being converted back to the two-digit 85.72 that appears on the chart. If you were using a spreadsheet program like Excel to draw the plain price charts you could do the conversion directly on the price data. If you print charts off the net or use a commercial charting program you may have no choice but to do the conversions before and after calculating the angles and the time spacing.
Using three digits for the calculations is a general rule and needs not be followed religiously. If the SPX started trading over 1,000 next week, we would not even consider converting the actual price levels to 100. Maybe if price climbed to 1,200 or 1,300 we would consider a conversion.
The basic concept we want to emphasize is that the angle (factor) selected for the grid should produce channel lines that look like normal trend lines as much as possible. You know that you hit the right combination if the channels reasonably contain the swing and if price is reliably vibrating between the tops and bottoms of the individual squares. Converting natural prices to three digits by multiplying or dividing by factors of 10 before doing the Square of Nine calculations
will change the size of the squares.
Higher natural or converted prices and lower factor numbers provide smaller price slices and smaller squares, suggesting that the duration of the data itself, hourly, daily, or weekly, may be one of the most important determining conditions.
Which Price Do I Use?
When working with daily, weekly, or monthly charts, there can be an enormous difference between the high or low price of a bar and the closing price of the same bar or the highest or lowest closing price that terminates a swing versus the most extreme price that terminates the same swing. Which price do you use for your Square of Nine calculations?
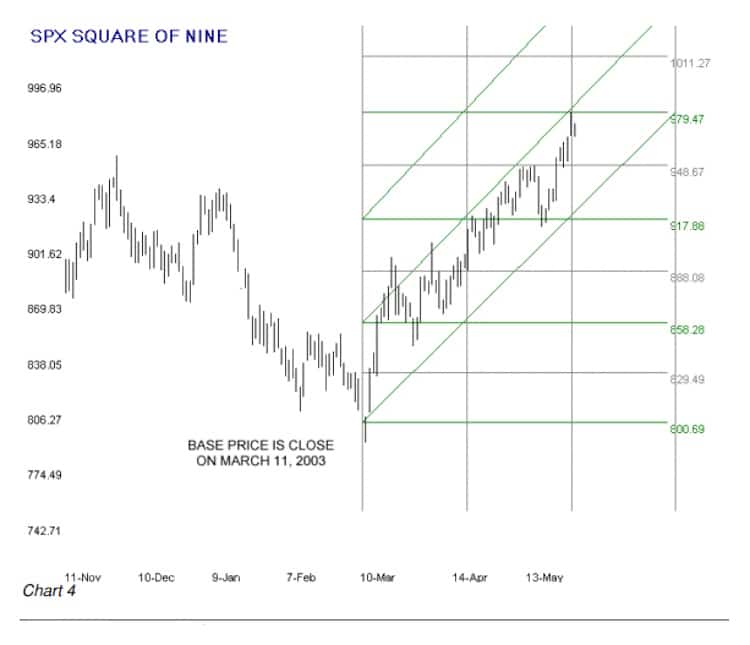
The best answer is to use both the highest or lowest close for a swing and the extreme high or low for a swing as a base price to make two separate charts. If the new swing persists, you can evaluate which base price choice is producing the most useful chart for you and discontinue the other. Chart 4 is a remake of Chart 1 of the SPX using the close on March 11 as the base price for the horizontal price lines in place of the intraday low on March 12, as we did with Chart 1.
One additional difference between Chart 1 and Chart 4 is that we added the 90 degree angle horizontal price lines to Chart 4. There is no universal rule that we can apply or pass on to you for constructing the perfect Roadmap chart for every ticker in every time frame. There is no substitute for experimentation and experience.
Variations on Time Spacing
There is a peculiarity with the Square of Nine Roadmap Charts in calculating the time spacing. This peculiarity is distinct from but related to the three-digit controversy. In all our example charts, we calculated the time spacing by taking the three-digit square root of the pivot price and rounding it.
When calculated this way, the time spacing produces a perfectly vertical line on the chart. A more precise method of calculation, particularly for daily charts, is to find the square root for each 180-degree angle (assuming of course, that the chart is based on 180 degrees or a factor of 1) and use that result as the time spacing on each separate horizontal line.
For example, the time spacing on the SPX chart (Chart 1) is a constant 28 bars. If we used the variable time spacing method, the bar spacing at the 720-degree angle at the price level of 1029 would be 32 bars. This will produce time spacing bars that slant slightly to the right from bottom to top on an uptrend but may produce better time-related results, particularly at higher price levels on extended moves.
There is one more variation in time spacing for the Roadmap charts. The explanation will probably not make sense to you right now, but it will when you finish the book. As previously explained, we calculated the time spacing for Chart 2 and Chart 3 by converting the natural base price of 84.26 to three digits = 842.6 (84.26 x 10) and taking the square root. 842.6 ^.5 = 29.02. The variation is to use the natural price 84.26 and determine the first number on the 84.26 angle of the Square of Nine that comes close to 29.02 and then use that number as the time spacing interval. In this case, that number is 26.83, which rounds to 27 for drawing by hand.
A Word About Gann Angles on Square of Nine Roadmap Charts
Much has been written on Gann Squares and Gann Angles and Gann Fans. Almost all high-end charting programs provide them as a user choice, although the help files may seem deficient in explaining how to actually use them.
We make absolutely no claims that the channel lines on the Square of Nine Roadmap charts accurately represent any particular so-called Gann Angle, 1×1, 1×2, or any other, or that the squares resulting from the vertical and horizontal lines are Gann Squares accurately drawn or otherwise.
W.D. Gann made all his charts by hand on specially scaled charting paper to achieve a specific rise over run for the tickers he traded. This scaling is not easily duplicated on different-sized computer screens or inkjet printers. The Roadmap charts stand on their own, and although their method of construction is also highly suited for hand drawing, there is no added value in defining them in terms they were never intended to match.
| <<Back to Square of Nine Roadmap Chart | Forward to Squaring Price with Price>> |


Pingback: Mystery Of W.D. Gann Square Of Nine Explained 3.2 - Square Of Nine Roadmap Chart Tradingfives.com
Pingback: Mystery Of W.D. Gann Square Of Nine Explained 5.1 – Squaring Price With Price