
Squaring the Price Range of the Current Trend with Time of the Current Trend
This particular technique is best suited for adapting to the concept that a squaring price need not necessarily be defined only by what occurred at one absolute moment in time such as a high or a low or a close. A daily bar, or even an hourly bar, is a very long time for a wave of energy that is in constant motion at an immeasurable speed. Visualizing price as an energy wave can be a very useful construct sometimes. We should be interested in all the prices that occurred during the period it takes to complete one bar.
This technique is best suited for squaring a price range that has occurred after 100 or more bars or calendar days. Generally speaking, the more bars or calendar days between the start date and end date of the range the better. A very nonmathematical explanation can be illustrated with the chart below. The chart graphs the angles for the numerals 1 – 247 as they cycle from 0 to 360 degrees.
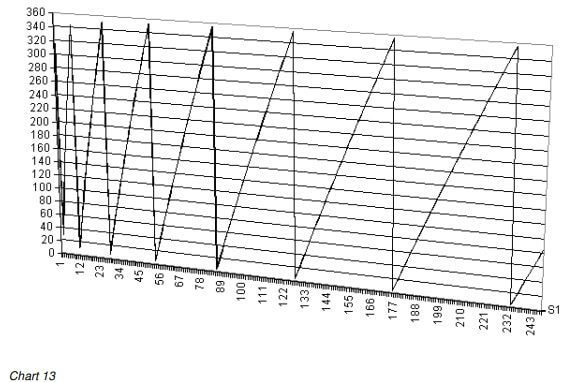
Although the magnitude and shape of the sawtooth pattern do not change as the number of bars or incidents increases, the slope of the change becomes flatter over time as the number of bars or days increases. In effect, the “noise” is reduced as time increases.
You could do this squaring calculation on a daily chart for any ticker from the first day after you suspect that the trend has changed. You will score hits from time to time, particularly as the number of trading days or calendar days increases, but we find that the best results on daily charts occur with well-defined trends that cover months of trading. This Excel chart of the DJX for the period from March 2002 to October 2002 shows the power of this technique.
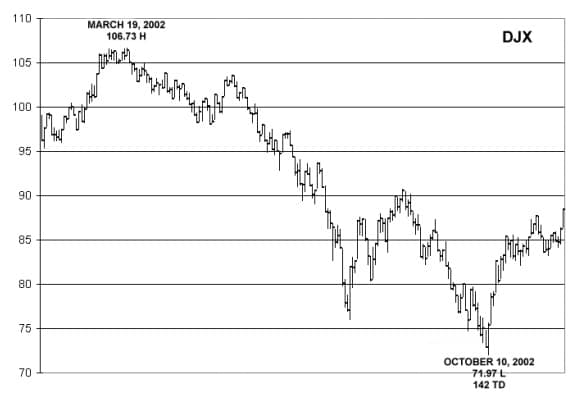
There were 142 trading days from the peak of the Bear Market rally that ended in March, 2002 to the Bear Market Low (to date) that occurred on October 10, 2002. The trading range from peak to valley was 34.76 points which rounds to 35. The degree conversion for 142 trading days gives a
result of 120 degrees. A price range of 35 converts to 120 degrees. The DJX squared price and time on October 10, 2002, the day of the Bear Market low to date, with the rally high on March 12.
If you do the math to two decimal places from the precise high to the precise low, the result will not come out a perfect 120 degrees, but at some undetermined moment within the two daily bars on March 19, 2002, and October 10, 2002, the DJX squared price and time exactly.
Using this technique we did not get a squaring with the March 19 high at the time of the previous Bear Market low in July. Was that a tip-off that the lower low was still to come?
| << SO9 7.5 Squaring Price That Ended A Prior Trend With Time In The Current Trend (tradingfives.com) |


Pingback: SO9 7.5 Squaring Price That Ended A Prior Trend With Time In The Current Trend
Hi, I am Arsenio from Goa India
I happened to see some pdf post where your book “SQUARE OF NINE with calculator and pencil”
It’s an e-book priced at $34.00, is it still available and the same price
How do I pay for it any payment gate or link please
Kindly share the details at my email below.
Thank you so much
Regards and Stay Blessed
Arsenio