
Squaring The Price Range in the Prior Trend with Time in the Current Trend
For this application you need the following information: the price range of the prior trend and the number of TDs and CDs that have elapsed in the current trend. For this example of the SPX squaring the price range of a prior trend with TDs in the current trend, we used another example from the Fall of 2002 which provided many distinguishable swings. Because the SPX was a three digit price at the time no conversion was considered.
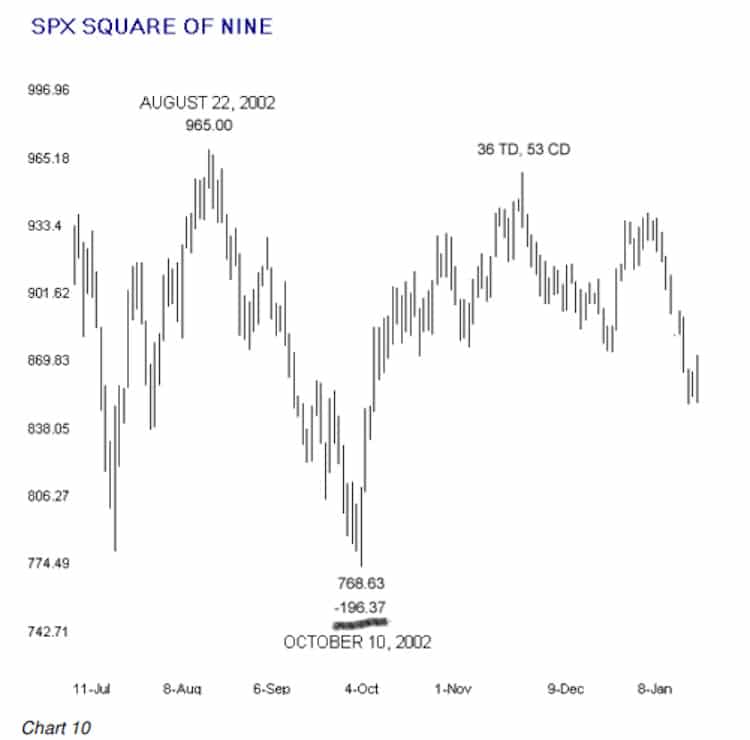
The high to low range of the August 22 – October 10 downswing was 196.37 points in the cash index. Rounding to 196 and reading directly from the Conversion Table we see that 196 points = 135 degrees. From the October 10 low to the high of the next swing was 36 TDs. From the Conversion Table we see that 36 also equals 135 degrees so the SPX has squared price and time at what turned out to be the beginning of a 146 point downswing in the cash index.
Here’s another example with a $20 stock. DELL made a swing low in September, ’02 and a swing high in November, ’02 with a closing price range of 6.64 points.

If you were following DELL in early February of 2003 could you have used the price range of the September – November upswing to get a handle on when the November-February downtrend might end?
Let’s do the math. 6.64 points converted to two digits is 66.4. Plugging 66.4 into the original Square of Nine formula we introduced provides a result that tells us that a price range of 6.64 points (converted because DELL trades at two digits) falls on the 161.75 angle on the Square of Nine. We could use the Table to determine what TDs or CDs would also fall on the 161.75 angle, or we can plug the angle of interest into a new formula and compute the result.
The Only Other Square of Nine Formula You’ll Ever Need
The formula to determine the relationship of all the numbers that fall on a particular angle on the Square of Nine is:
(((2 * n) + ((2 * x)/360) + 1.25)^2 Where “n” = number of the rotation and “x” = angle of interest. For almost every use of this formula, you will start with n=1 or n=2 and repeat the calculation for each new “n” until you have completed as many rotations as you think will be useful for the particular application at hand.
The keystrokes for starting with n=1 and applying the formula with an angle of interest of 161.75 on a calculator with no parenthesis and a memory STO and memory RCL function key are:
2*161.75 = 323.5 / 360 = .8986 + 1.25 = 2.1486 STO
2*1= 2 + RCL = 4.1486
4.41486 ^2 = 17.2
2nd iteration:
2*2= 4 + RCL = 6.1486
6.1486 ^2 = 37.8
3rd iteration:
2*3= 6 + RCL = 8.1486
8.1486 ^2 = 66.39
The results of plugging the angle of 161.75 into the new formula and running through three iterations gave us the number of three possible TD or CD counts on which we would look for a change in trend (17, 37, 66).
Oh, oh. If you check the results, you will find out that none of these TD/CD possibilities scored a hit on February 10, and if this is all you had done with this technique, DELL would have reversed the downswing and launched into a 7-point rally without you.
What are we missing? Price and time “square” on the same angle on the Square of Nine, in this particular case an angle of 161.75 degrees. In the financial markets, price and time also square at the three 90-degree offsets to the angle at interest. We should have done more work and used the new formula to go through the same three iterations with angles of interest of 251.75, 341.75, and 71.75, the 90 degree offsets to 161.75.
As it tuned out, the 3rd iteration of the 71.75 degree offset hit on the number at 58 TDs.
We used this DELL example for a couple of reasons. One reason is to introduce the second and last formula that you will ever need to mathematically apply the Square of Nine in any market in any time frame. The first formula converts numbers to degrees (angles) and the second formula converts degrees to all the numbers that lie on that angle on the Square of Nine. It’s easy enough to use the second formula to also do the calculations for the three 90 degree offsets of the primary angle, in effect, squaring the circle.
The second reason is to drive home the point that, in most cases, the spatial relationship between price and time that will stop a move cold or change a trend will not jump off the chart and tell you where it is. There is no substitute for doing the work.
| << Squaring Time in a Prior Trend with the Price Range of the Current Trend | Squaring Price That Ended a Prior Trend with Time in the Current Trend >> |


Pingback: Square Of Nine 7.3 Squaring Time In A Prior Trend With The Price Range Of The Current Trend
Pingback: SO9 7.5 Squaring Price That Ended A Prior Trend With Time In The Current Trend