
How to Spot Market Trends and Key Waves with the Elliott Wave Oscillator
The Elliott Wave Oscillator (EWO) is a simple yet powerful indicator that can help you identify and trade the major market swings. It is based on the Elliott Wave Theory, which states that prices move in a series of five waves in the direction of the main trend, followed by three corrective waves in the opposite direction. The EWO measures the difference between two moving averages of prices, and displays it as a histogram above and below a zero line. By using the EWO, you can:
- Find the most profitable waves: The EWO can help you spot the third wave of each cycle, which is usually the longest and strongest Elliott Wave pattern. The highest or lowest point of the EWO histogram corresponds to the end of the third wave, and indicates a potential reversal point.
- Confirm the wave count: The EWO can help you validate the wave structure and formation by following some basic rules and guidelines. For example, the EWO should be positive during an uptrend and negative during a downtrend, and the EWO should return to zero during the fourth wave of each cycle.
- Detect divergences: The EWO can help you identify divergences between the price and the oscillator, which signal a possible change in the trend direction. For example, if the price makes a new high but the EWO fails to do so, it may indicate that the fifth wave is ending and a correction is imminent.
In this article, you will learn how to use the EWO to analyze the price movements and trade the Elliott Wave Patterns in any time frame and market. You will also learn how to use the Operative Time Frame Chart, a technique that helps you display the correct number of bars for the EWO to work effectively. Read on to find out more.
What is the Elliott Wave Oscillator and Why You Should Use It
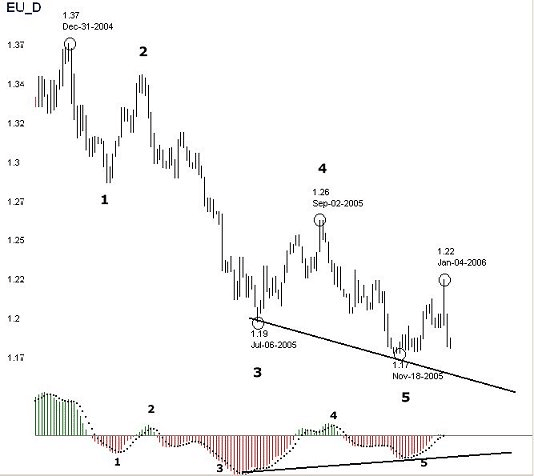
The Elliott Oscillator, or 5/34 Oscillator, is a 34 period simple moving average of prices subtracted from a 5 period simple moving average of prices displayed as a histogram above and below a zero line. You can duplicate the Elliott Wave Oscillator on charting programs with a MACD feature. It can be applied to any time frame (intraday, daily, etc.) and works equally as well in every time frame provided that the correct number of bars are displayed in the chart. The chart below is a good example of how effective this technique can be in counting Momentum Waves.

Whether or not Momentum Waves could be considered as true Elliott Waves is not important. We just accept that they are not and use them for what they are very good at doing: identifying the current state and the probable termination point of a swing. The most important single concept about the Elliott Oscillator is that the highest/lowest point of the Oscillator is connected to the bullish/bearish Wave 3 of the swing.
Related concepts are:
- that Wave 4 crosses the zero line in the opposite direction of the trend.
- Wave 5 often makes a new high or low price for the swing but always diverges from the Oscillator.
- If the suspected Wave 5 makes a new extreme price simultaneously with a new Oscillator extreme, then it is not a Wave 5.
This happens fairly often with intraday charts. What you’re seeing in that situation is an extended Third Wave, which carries the implication of a significant price move in the direction of the trend yet to come.
Operative Time Frame Charts
The Elliott Oscillator is most effective when the chart has the “correct” number of bars. From 100 to 150 bars is the correct number of bars to use with the oscillator. Dr. Bill Williams suggests 100-140. Tom Joseph implies that 150 is right. We like to use about 120 bars, which is comfortably in the middle of that range and has consistently produced reliable results.
There is nothing magic about 120 days, 120 hours or 120 minutes. Although an Operative Time Frame Chart could coincidentally be any of these time periods, constructing this chart has nothing to do with fixed time periods. Put simply, an Operative Time Frame Chart is a bar chart that starts at a significant pivot point and displays 120 bars of the swing that started at that particular pivot point.
If analyzing small time frames, like on our Hourly Charts, an Operative Time Frame chart will display about 120 bars of anywhere from 15 to 240 minutes of intraday data. The time period of the bars in the chart is arranged to always show the swing as an event consisting of about 120 bars. The sample SPX chart comprises 85-minute bars. This more recent Eurodollar chart comprises two-day bars. The completed five wave sequence would be invalidated by any move below the suspected 5th wave 1.17 low.
What Can You Do With an Operative Time Frame Chart?
- Closely determine the probable time period of the end of a correction.
- Avoid losses by reversing too early on a swing that looks complete.
- Closely determine the likely termination of a swing of any degree.
- Decide in one second whether you should be long or short.
Not bad credentials for a simple tool.
Conclusion
- The Elliott Oscillator is a simple but effective indicator that subtracts a 34 period simple moving average of prices from a 5 period simple moving average of prices and displays the result as a histogram above and below a zero line.
- The most important concept of the Elliott Oscillator is that the highest/lowest point of the histogram is connected to the bullish/bearish Wave 3 of the swing, which is usually the most powerful and profitable wave in a trend.
- The Elliott Oscillator can also help traders determine the likely end of a correction or a swing by observing the zero line crossing, the divergence between price and oscillator, and the number of bars in the chart.
- The Elliott Oscillator works best when the chart has the correct number of bars, which is about 120 bars. This can be achieved by adjusting the time period of the bars to fit the swing of interest.
Call to Action
- Unlock the secrets of market trends with the Elliott Wave Principle! 📈 Discover hidden patterns, identify trend reversals, and gain confidence in your trades. Learn from R.N. Elliott’s 1930s discovery and start your journey to becoming a more informed trader. 🌐


Pingback: Elliott Wave Pattern Guidelines